HR Dashboard GB
KPIs Summary
Visualization by: Gbolahan Adebayo
Date: June, 2024
Type: Business Dashboard
Link to Visualization: Click Here
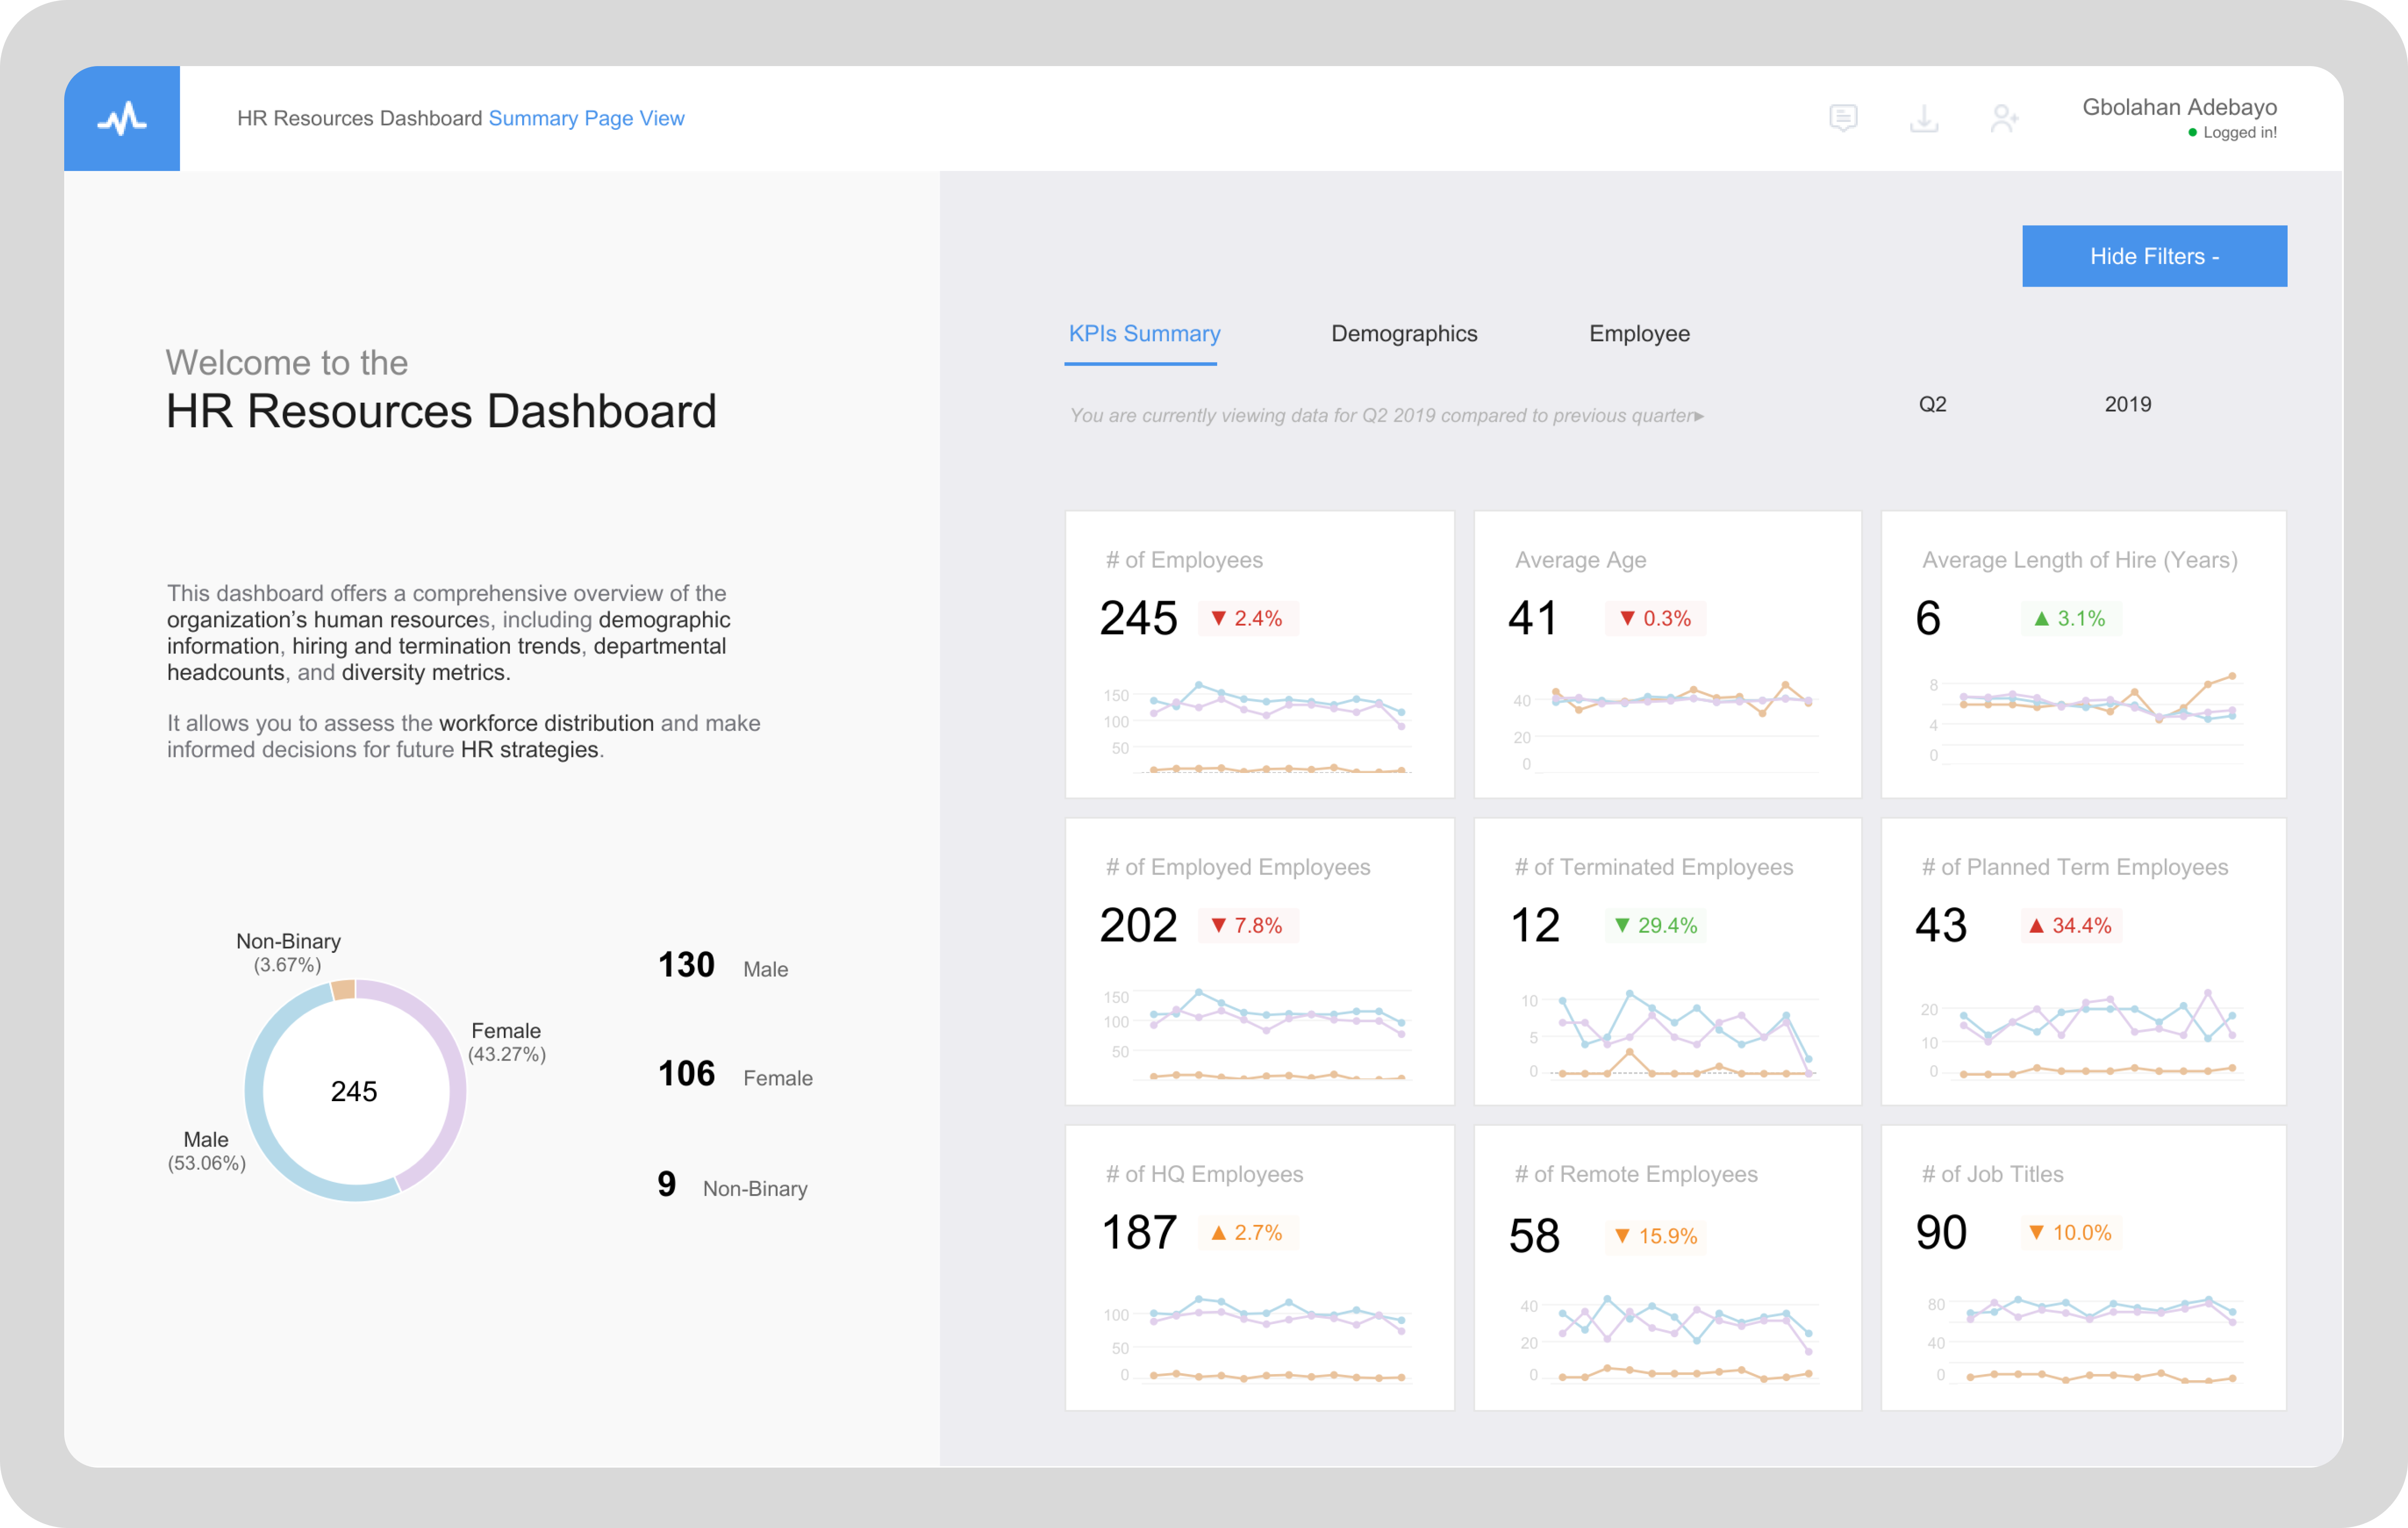
The “KPI Summary” page of the HR Resources Dashboard provides a high-level overview of key workforce metrics, offering insights into the organization’s human resources trends and distributions. It highlights crucial metrics such as the total number of employees, average age, and average length of hire, while also tracking the number of employed, terminated, and planned term employees. For Q2 2019, the organization reported 245 total employees, reflecting a 2.4% decrease from the previous quarter, with an average age of 41 years and an average length of hire of 6 years, which increased by 3.1%.
The dashboard also presents workforce segmentation, showcasing that 53.06% of employees are male, 43.27% are female, and 3.67% identify as non-binary. Additional metrics include the breakdown of headquarters employees (187, down 2.7%), remote employees (58, up 15.9%), and the number of job titles (90, down 10%). Visual trend lines accompany each KPI, allowing stakeholders to analyze changes over time and identify patterns.
This page serves as a central reference for HR teams, enabling them to monitor workforce dynamics and assess the impact of hiring, termination, and retention strategies. By providing both current metrics and historical trends, the dashboard facilitates data-driven decision-making to support the organization’s human resources planning and management efforts.
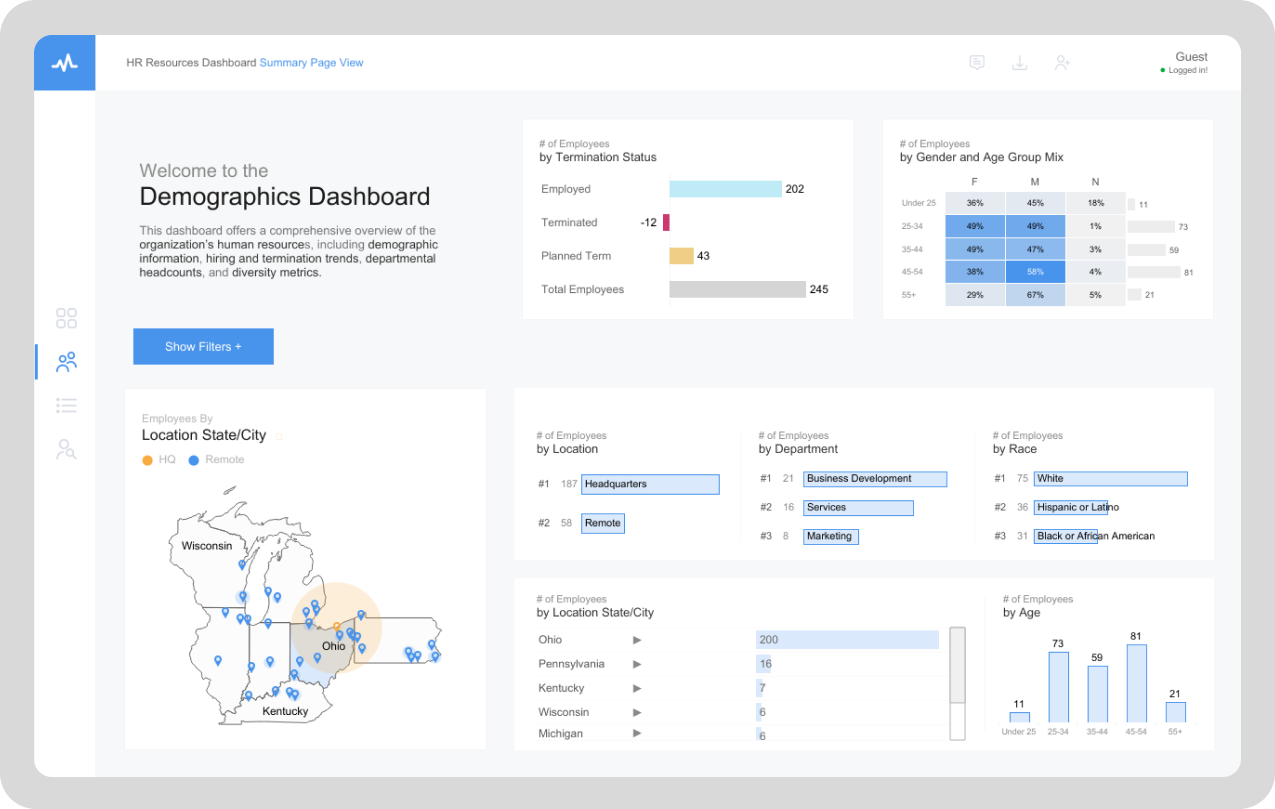
Demographics Dashboard
This page provides a comprehensive overview of the workforce, starting with employee status metrics, showing the number of currently employed, terminated, and planned terminations. Diversity metrics break down employees by gender, age group, and race, offering insights into inclusivity. A geographical distribution map shows the spread of employees across locations, differentiating between headquarters and remote workers. Additionally, the page includes a breakdown of employees by department and detailed age group distributions, helping HR teams understand workforce demographics and trends.
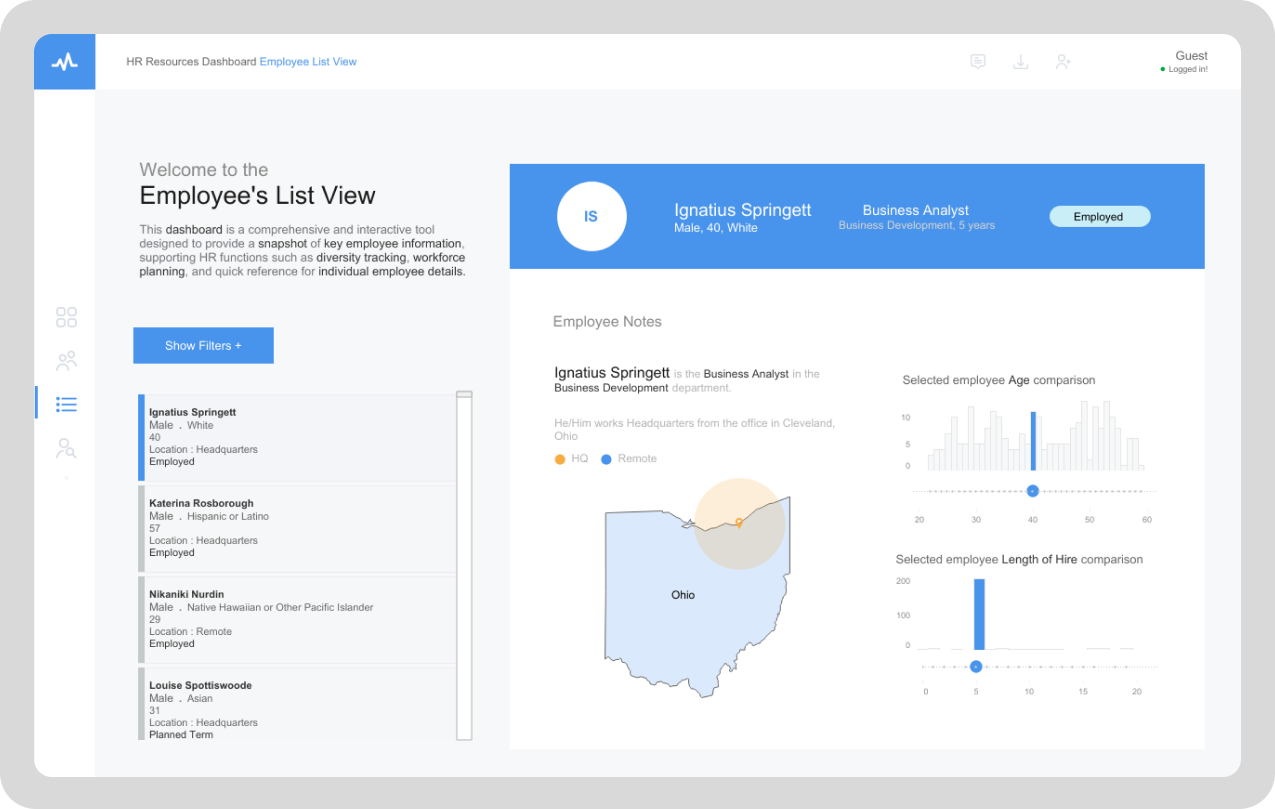
Employee List View
This page focuses on individual employee details, offering a scrollable directory that displays essential information such as names, ages, races, locations, and employment statuses. Selecting an employee reveals a detailed profile with their role, department, tenure, and work location, along with personalized notes. Comparative charts benchmark the selected employee’s age and tenure against the overall workforce distribution. A map pinpoints the exact location of the employee, providing both a visual reference and detailed context for individual workforce analysis.